
Deskripsyon
Charts, Graphs, COVID Widgets with iChart
Responsive Charts and graphs are now easy to build and add to any WordPress page with just a few clicks and shortcode generator. iChart is a chartjs implementation to add beautiful, responsive graphs & charts to your site easily – directly from WordPress page or posts editor.
GeoChart is supported in the Pro version.
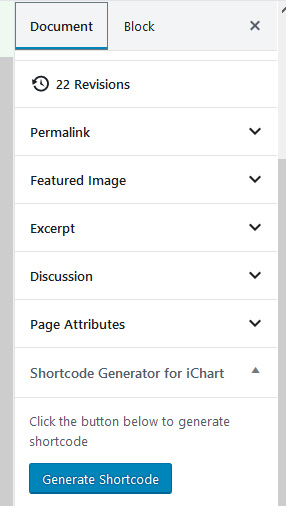
iChart includes Shortcode Generator Graph and Chart Block for Gutenberg and iChart’s chart and graph shortcode generator is compatible with Guttenberg and any other visual editor. See screenshots below.
iChart supports creating and building Pie Chart, Bar chart, Line Chart, Polar Area Chart, Radar Chart, and Doughnut Chart that are optimized to address your WordPress data visualization needs. Visualize your data now more easily than ever with iChart chart builder!
iChart Pro supports visual chart builder, data table, GeoCharts, embed sharing and more!
Check out the Demo of iChart Pro VersionBuild incredible Charts. Upgrade to iChart Pro Now!
iChart provides Simple yet flexible JavaScript chart building ability. It creates HTML5 and fully Responsive charts which are mobile device friendly and looks great for data visualization. iChart is supported for all browsers where canvas is supported. Browser support for the canvas element is available in all modern & major mobile browsers as well.
iChart allows you to define individual background colors for different data points and labels. Just use the iChart shortcode generator to generate and embed your chart or graph to any WordPress page or post.
iChart support multiple responsive charts and graphs on the same page.
iChart allows you set each chart and graphs size from the shortcode generator.
🚀 Give our FREE AI ChatBot for WordPress – WPBot a try! This super-easy, native WordPress chatbot doesn’t require any coding skills and provides automated live chat support. Use WPBot to answer user questions and gather information through conversational forms. You can power it with DialogFlow or OpenAI ChatGPT, or simply use its built-in features for live support and data collection. ++ Take a look at the #1 ChatBot for WordPress WPBot demo.
Do More with iChart Pro!
Need to create a comprehensive Chart or Data Table that you will need to edit later? iChart pro lets you create Charts, Graphs and Data tables with a Lot of customization options that you can reuse and embed on any page with shortcodes. Enable the Embed button to let your website users embed the Charts, Graphs and Data tables you created on their own website easily. This unique feature is not available in any other plugin.
All Free Version Features of the iChart
⭐ Supports Pie Charts, Bar charts, Line Charts, Doughnut Charts and Polar Area Charts
⭐ Quick ShortCode Generator for Charts
⭐ HTML5, Responsive Charts
⭐ No Chart saving or data table option
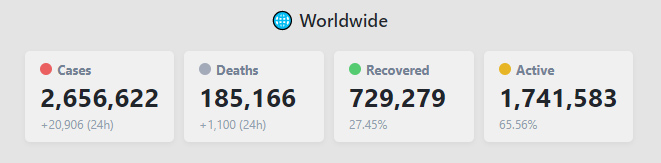
⭐ COVID-19 Worldwide Live stats widget
⭐ COVID-19 Country wise Live Data Ticker sidebar widget shortcode
All Pro Version Features of the iChart
⭐ Create jQuery based Data Tables
⭐ Use ShortCode with ShortCode Generator to Embed Charts on Any Page Quickly
⭐ Generate Quick Chart with ShortCode or Save and Reuse Comprehensive Charts
⭐ HTML5, Responsive and Animated Charts and Graphs
⭐ Supports Multiple Datasets
⭐ Create GeoCharts
⭐ Location auto complete using Google Map API
⭐ GeoChart Display mode – Regions, Markers, Text
⭐ Change Data highlight colors for GeoCharts
⭐ Visual Table Mode to Easily Enter and Edit Chart Data
⭐ Add/Remove Rows and Columns with Click of Buttons
⭐ Customize Background Colors for each Dataset
⭐ Three Positions to Display Chart information Top, Bottom, and Right of the Chart
⭐ Supports Links for each data
⭐ Option to hide Chart Information and show only the Chart or Graph
⭐ Show/Hide Chart Title
⭐ Supports Custom Text to Show after Tooltip and information
⭐ Custom CSS to add your own style
⭐ Full customizable options and control over Typography
⭐ Customizable Width, Text Color, Font Size, Background Color, Border etc.
⭐ Show and Hide Horizontal and Vertical Grid lines
⭐ Import/Export Chart Data
⭐ Powerful short code Generator for both Gutenberg and Classic Editor
⭐ Live Chart Preview on Admin after Save
⭐ Enable Embed Option to allow anyone to embed your chart on their website.
Check out the Demo of iChart Pro Version
Build incredible Charts. Upgrade to iChart Pro Now!
Who is this Chart Builder for?
iChart is a useful chart plugin for you if you are a:
- Blogger
- SEO Specialist
- Content Curator
- Marketer
- Webmaster
- Data Visualizer
- Anyone with a WordPress website
What Can You Do with iChart – Chart Builder?
Create beautiful, elegant Infographics with Charts and Graphs – any page anywhere with short code.
Use the Gutenberg Block to Generate Chart and Graph directly from the page or post editor.
iChart supports creating and adding Bar chart, Line Chart, Polar Area Chart, Radar Chart, Pie Chart and Doughnut Chart.
Use
Create a new page and use the iChart button from your Visual editor to generate and embed your chart in any page or post.
Mga Screenshot


Blocks
Ang plugin na ito ay nagbibigay ng 2 (na) block.
- Quick iChart
- iChart – Shortcode Maker
Pag-install
- Download the plugin zip file. Extract and upload iList in your wp-content/plugins folder.
- From the wp-admin panel goto plugins and activate “ichart”
- Create a new page and use the iChart button from your Visual editor to generate and embed your chart in any page or post
- Publish and you are done.
FAQ
-
How to Create Charts and Graphs?
-
Charts are create and added with the iChart Shortcode Generator button found in the Visual Editor for your WordPress post or pages.
-
Can I add more than one chart on a page?
-
Yes, from version 1.0 you can
-
My chart settings are not saved when I try to edit
-
Charts are created on the fly and configurations saved in the shortcode. So, it is not possible to save charts that can be edited in the chart creation interface again.
Mga Review
Mga Contributor at Developer
Ang “iChart – Easy Charts and Graphs” ay open source software. Ang mga sumusunod na tao ay nag-ambag sa plugin na ito.
Mga ContributorIsalin ang “iChart – Easy Charts and Graphs” sa iyong wika.
Interesado sa development?
Tingnan ang code, i-check ang SVN repository, o mag-subscribe sa development log sa pamamagitan ng RSS.
Changelog
2.1.5
Updated Nav Menu
2.1.4
Fixed some security issues
2.1.0
Fixed a plugin redirect issue on activation
2.0.9
End Eid Sale
2.0.8
Eid Sale
2.0.7
Fixed floating value issue
2.0.6
Updated the support section
2.0.4
Removed COVID features
2.0.3
Remove Admin notice
2.0.2
Remove Admin notice
2.0.0
Admin notice
1.9.9
Fixed PHP warnings and button style
1.9.7
Fixed COVID data API
1.9.6
Replace (window).load() with (window).on(load)
Make JavaScript Compatible with WP 5.6
1.9.5
Updated COVID-19 Corona Virus Widget Data Endpoint
1.9.4
Added COVID-19 Corona Virus Widgets
1.9.3
Fixed issue with gutenberg block
1.9.2
Improved Chart size
1.9.1
Added Animation when the chart is on the viewport
1.9.0
Remove legend for bar, line and radar chart when there is no datasetname
1.8.0
Fixed conflict with Auto Optimize
1.7.0
Fixed shortcode generator for Gutenberg
Fix Chart invisible issue when there is multiple chart with same title
Fix color selection not working for datapoint on line and radar chart
1.6.0
Introducing the pro version
1.5.0
Gutenberg Block for Chart and Graph
1.3.0
Gutenberg compatibility
1.2.0
max width issue fixed.
Warning: call_user_func_array() expects parameter 1 – fixed.
1.1.0
Removed unused menu
1.0.0
- Added multiple charts and graphs on the same page support
- Added chart size support
0.9.0
- File name case fixed
0.8.0
- Inception